- The Breakdown
- Posts
- 🟪 Friday crypto charts

Brought to you by:

“Graphical excellence is that which gives the viewer the greatest number of ideas in the shortest time with the least ink in the smallest space.”
— Edward R. Tufte

Friday crypto charts
I joined Blockworks just a few months before bitcoin hit its 2021 peak of $64,000, and when I told people I wrote about crypto, they were almost always interested and almost always had questions about it.
After the Luna crash just a few months later, I’d tell people instead that I wrote about “crypto and finance”; and after FTX crashed I said “finance and crypto.”
By the time bitcoin hit $16k, I just told people I wrote about “finance” and hoped they wouldn’t ask any follow-up questions.
Now, with coin prices booming again, I’m back to saying “crypto and finance” — and would probably just say “crypto” if I didn’t think that would jinx it.
Part of my claim to write about more than just crypto has always been Friday charts — but that’s only because I wanted to do charts on Fridays (I love charts) and when I started in 2021, there weren't many crypto charts to share, so Friday charts were about equities, and macro-related by necessity.
Things are different now because 1) crypto has more activity on more chains than it ever did and 2) the industry has much better sources of information.
As a result, looking at crypto charts may be the best way to keep on top of things, as I hope you’ll find below.
If you’re a reader of the 0xResearch and Empire newsletters, a listener of the Blockworks Research podcast, and a follower of Blockworks’ Dan Smith on X, some of these charts might be repetitive for you — but Blockworks’ content has become so prolific that I think a little curation might be welcome.
I do plan to continue curating some of the news from the worlds of TradFi and technology: If I hadn’t used up so much of my word count on this explainer I’d have opined on the S&P 500 just completing its best back-to-back years since 1998, the surge in “high-propensity” business applications that bodes well for US productivity, the significance of Microsoft’s AI mini-computers, and investing takeaways from a podcast with Christopher Bloomstran, who is as traditional as traditional finance gets.
Three years into writing about crypto, I remain mostly traditional myself — I’m more excited about this week’s pullback in shares of Sherwin Williams than I am about the pullback in memecoins, for example.
(Sherwin Williams the paint store, yes. It’s a great business.)
But crypto is both 1) a lot of fun to follow and 2) a great way to learn about all of finance — and as of just recently, charts have become a great way to learn about crypto.
So, as of today, Friday’s charts will be about crypto (that’s me unveiling the new charts in the photo above).
But only provisionally. We’ll have to see how it goes — if you think this is a terrible idea, let me know and maybe we’ll change it back.
Or just wait a few months when I’ll probably be telling people I write about “finance” again.
Crypto has a valuation metric now:
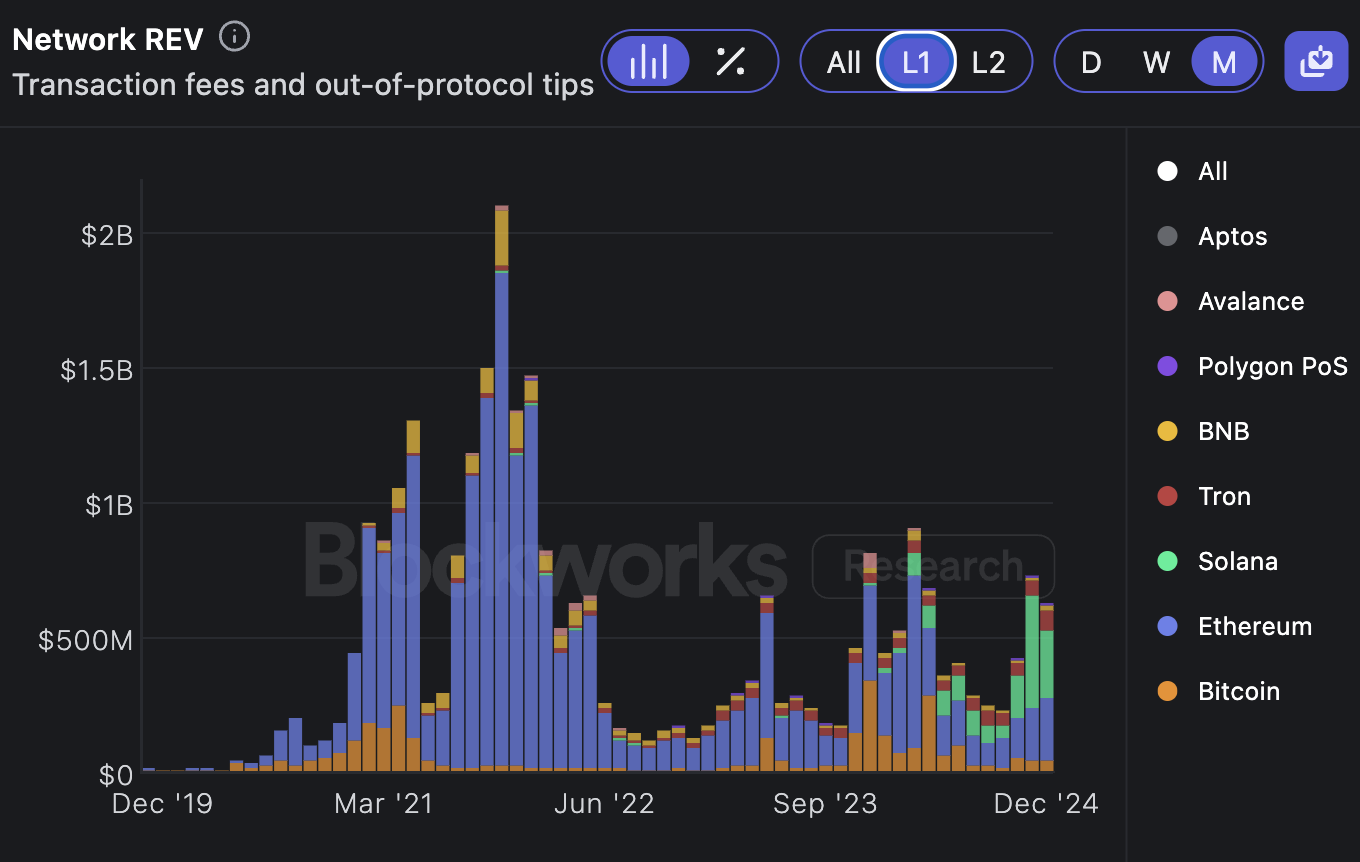
“Real economic value” is catching on as the metric by which layer-one blockchains like Ethereum and Solana should be valued, so I'll be sharing this chart from Blockworks Research frequently (maybe every week, even). To me, the shrinking blue bars of Ethereum revenue is a visual representation of the need for higher transaction volumes to offset lower transaction costs (if we choose to value blockchains by a multiple of revenue, that is). The other thing that jumps out at me here is that the growing green bars of Solana revenue have only really taken off over the last three months — it feels like it’s been much longer than that, which makes me wonder if it’s as sustainable as everyone assumes.
Also sustainable?
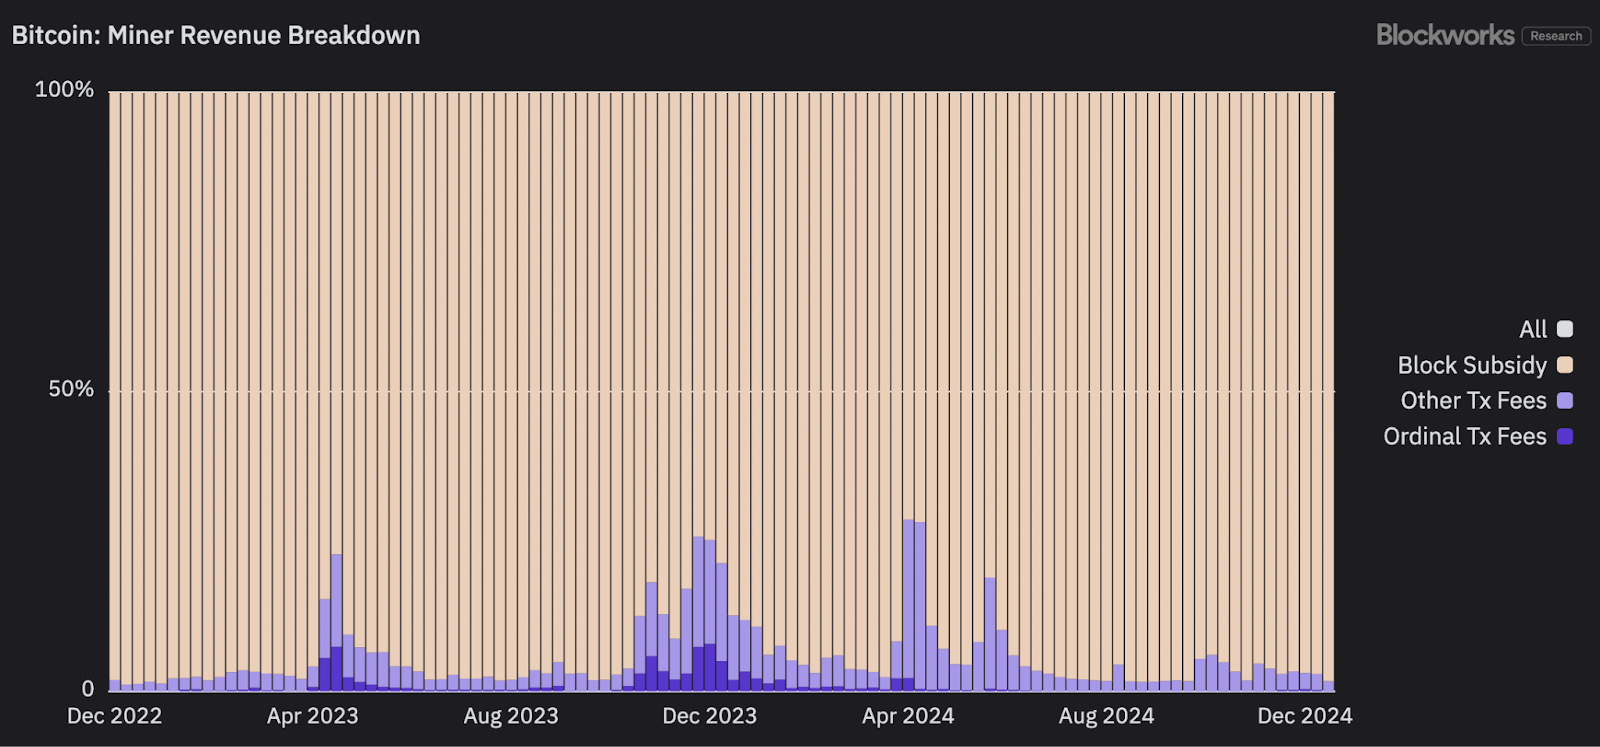
There’s a roaring bull market in the price of bitcoin, of course, but it’s perhaps worth noting that there’s also a bear market for Bitcoin blockspace. The craze for Ordinals and Inscriptions that spiked Bitcoin fees in December and April proved short-lived, leaving Bitcoin’s long-term security as dependent on issuance as it ever was. This is probably nothing to worry about, however — if all else fails, I’m sure BlackRock, the US government and MicroStrategy will mine Bitcoin blocks for free.
The chains where it happens:
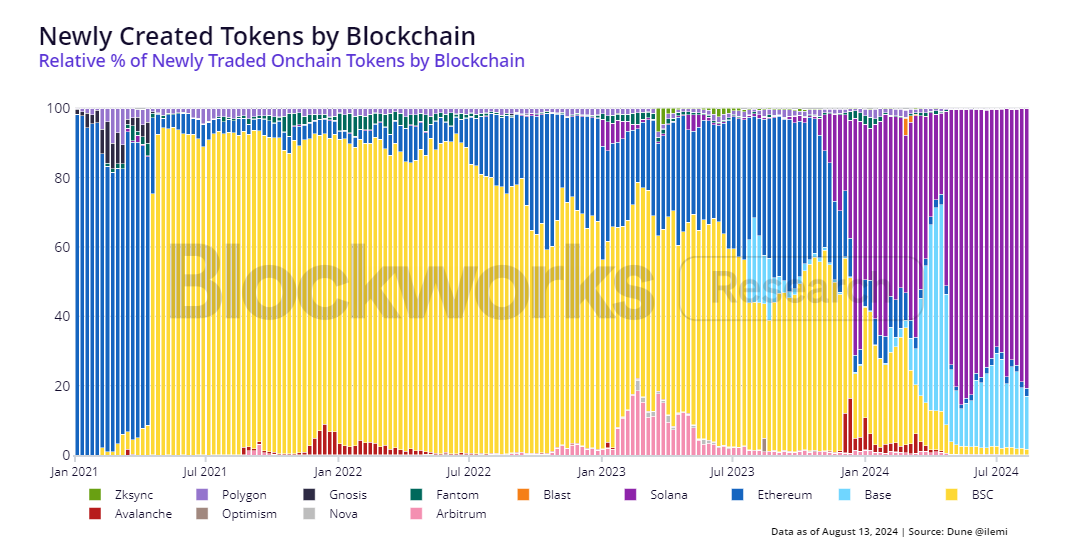
This chart needs updating, but it’s nonetheless a useful history of crypto token issuance: First, the tokens were all issued on Ethereum (the blue bars), then on Binance Smart Chain (yellow), and then, more recently, on Solana (purple) and Base (light blue). I think this is important to follow because the best forward-looking metric for layer-one blockchains might be how many tokens are launched there. So this chart (if I can get it to update) will be a regular feature, too.
Are ETFs scaling Ethereum?
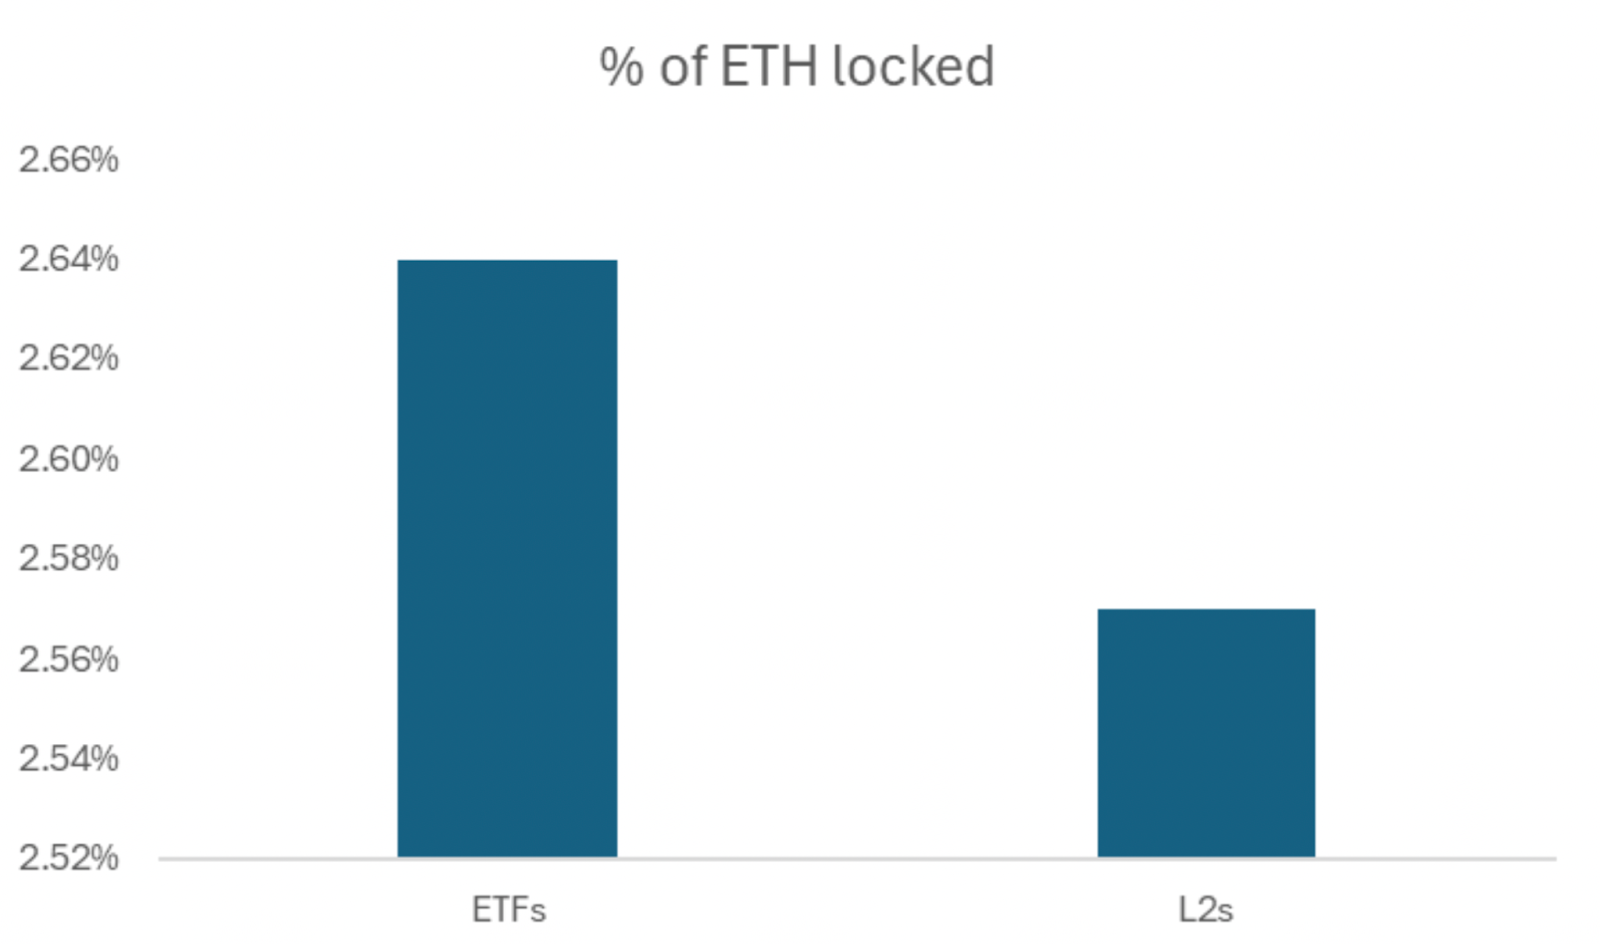
Blockworks Research analyst Marc Arjoon notes that ETFs now hold more ETH than Ethereum layer-two blockchains (like Arbitrum and Base). The case for ETH as money has been predicated on the idea that people will hold it on the L2 blockchains that scale Ethereum. But if ETH is more commonly held in ETFs, does that also make ETH money and/or scale Ethereum? I don’t think it does in either case, but most crypto people probably disagree.
Less ETH is traded on Ethereum:
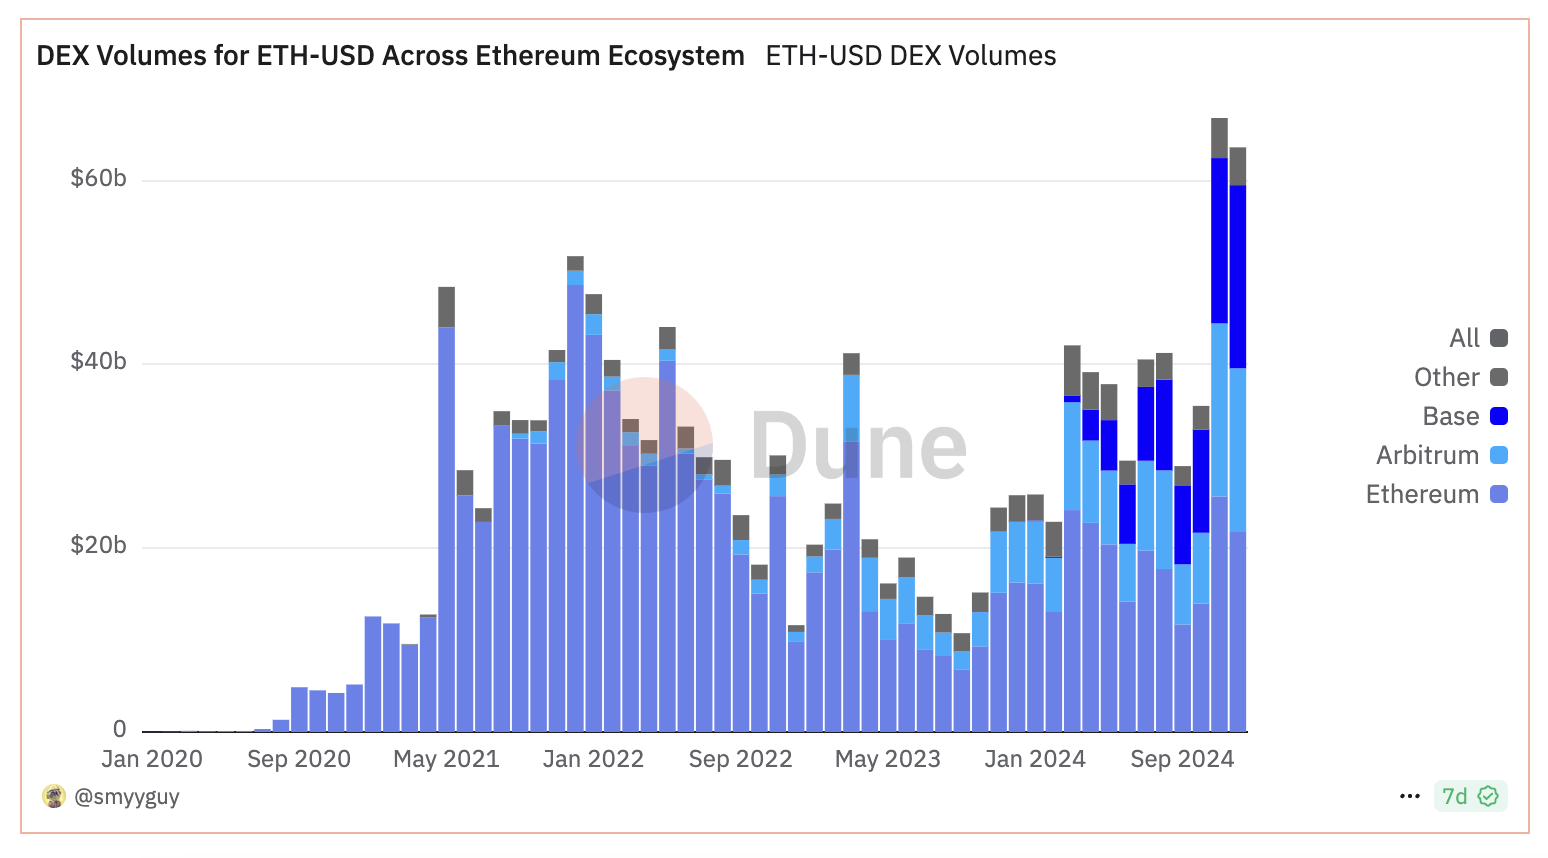
This chart from Blockworks’ Dan Smith shows that more ETH is traded on Base and Arbitrum than on Ethereum now. I guess that was the plan all along, but now that I see it in a chart, I wonder if it was a good plan.
All about that Base:
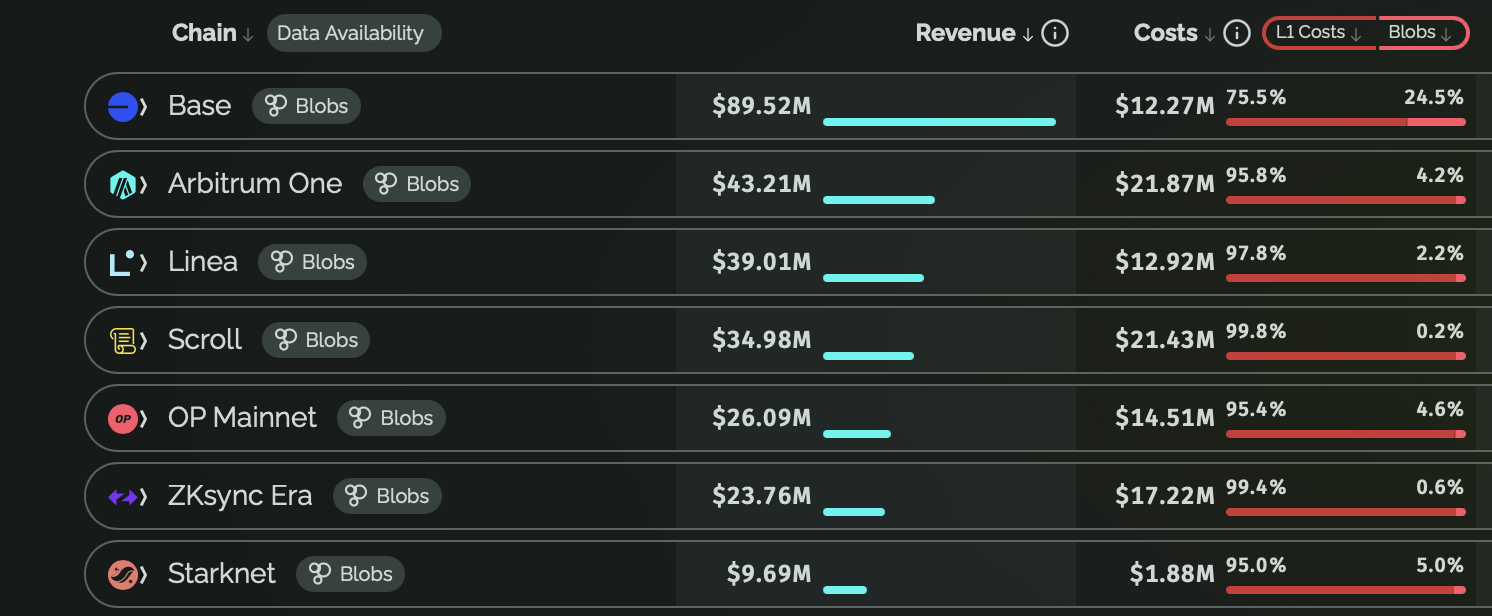
Data from growthepie.xyz shows just how dominant Base is becoming in the Ethereum ecosystem: Base did more than double the fees of Arbitrum over the last month (and incurred nearly half the cost).
Ever-shifting crypto narratives:
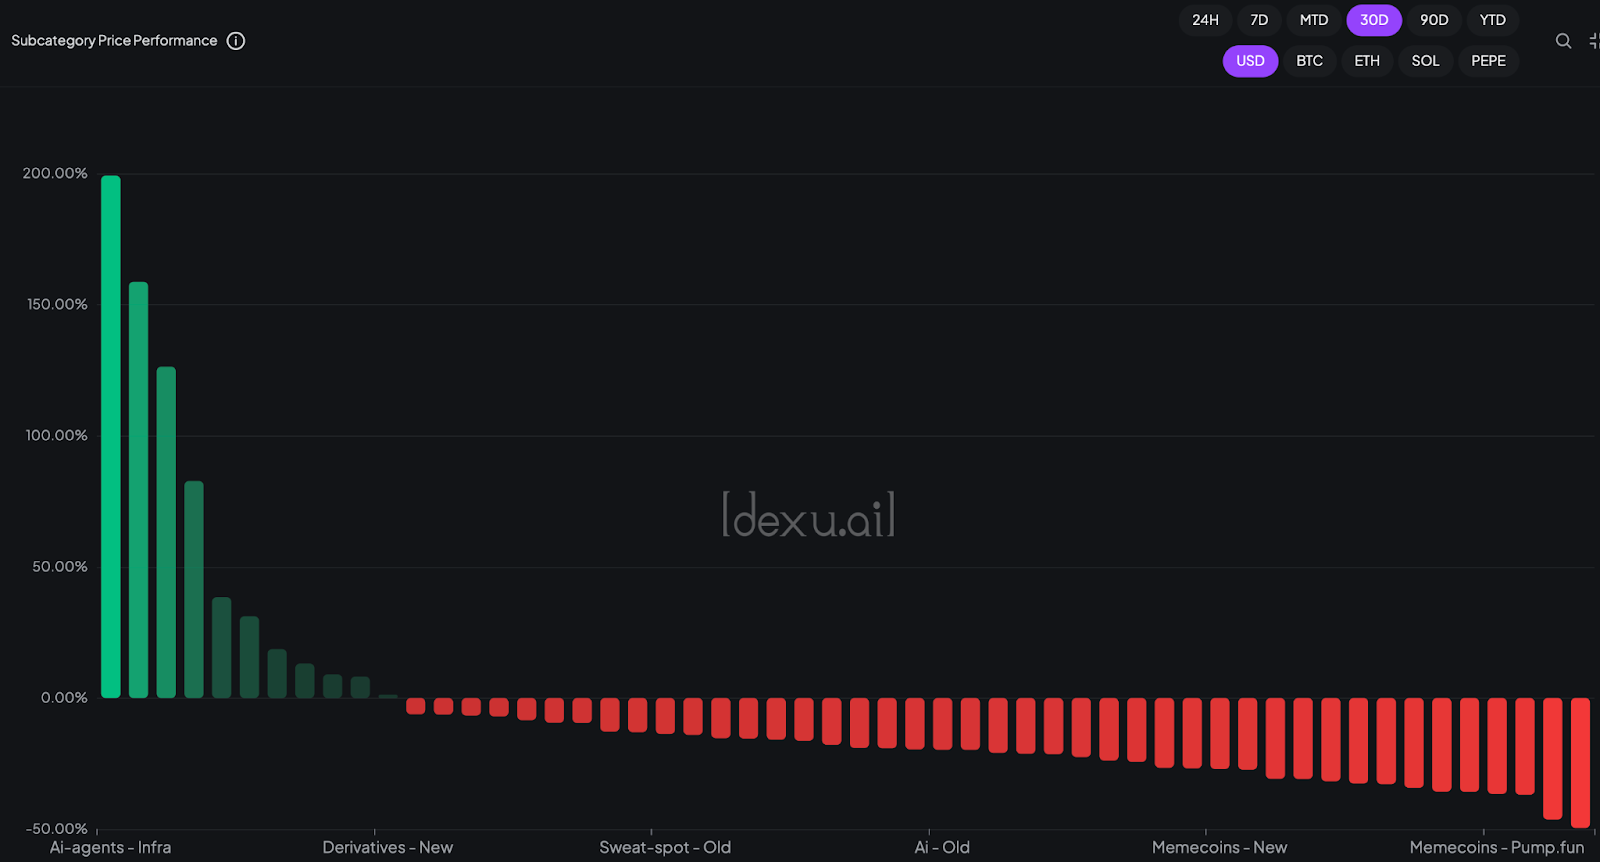
This one-month performance snapshot from dexu.ai shows that AI agent coins (the green bar at the left) were up +200% in December, in part because people rotated out of memecoins issued on pump.fun (the red bar to the right), which fell 37%. The joke here is that AI agent coins are mostly memecoins themselves, but crypto loves a new narrative and “AI agents” is an unusually good one.
The future of finance:
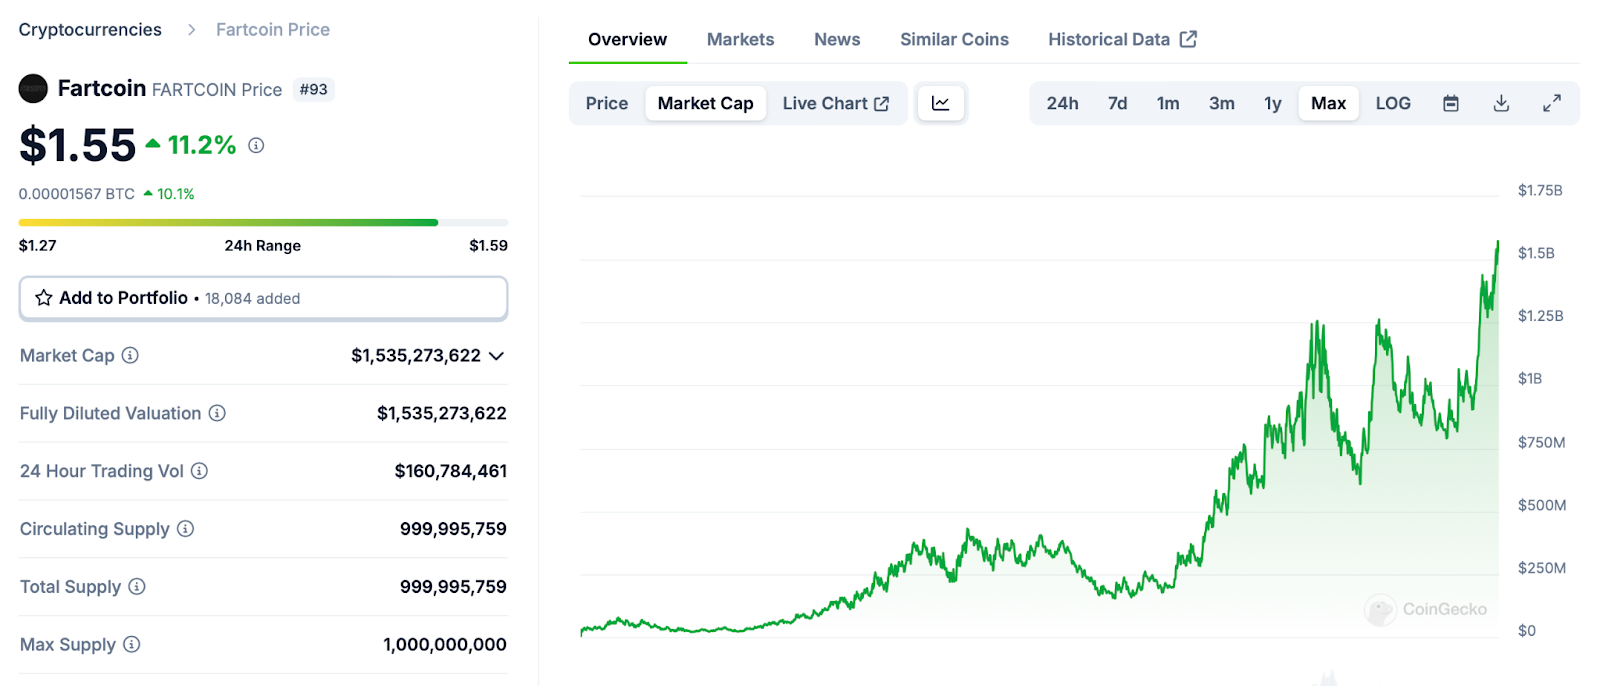
Fartcoin is a pure meme but has somehow caught the AI agent wave, trading up another 11% today, 90% on the week, and nearly 900% over the past month. Better yet, it’s a meme that’s breaking out of the crypto echo chamber. In a satirical investor letter out this morning, Cliff Asness wrote “you will have to pry our Fartcoin from our cold dead bums.” Any memecoin that gets the attention of Cliff Asness is on to something.
The HODL chart:
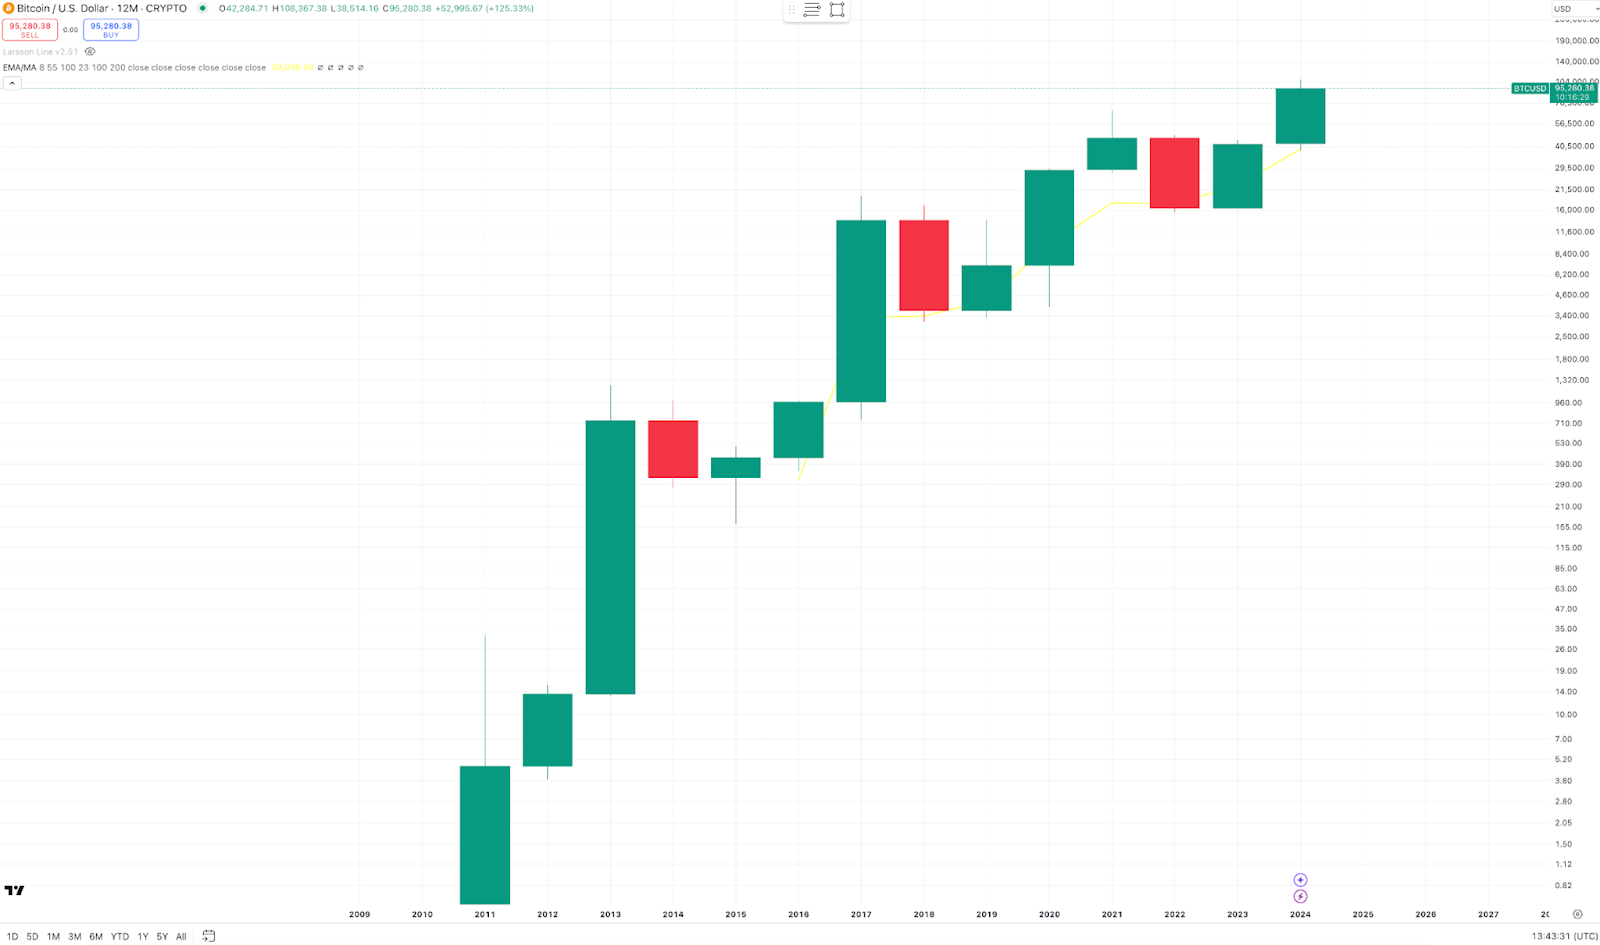
The best charts are the simplest ones and it doesn’t get any simpler than this yearly chart of bitcoin prices from my colleague Macauley Peterson. I need to print this one out and tape it to the wall to stop me from selling in the next downturn like I did in 2018, 2020 and 2022. I’m a visual learner, I guess.
So that’s our very first Friday of crypto-only charts.
Please let me know if you found these helpful or if you’d rather hear from me about macro on Fridays: [email protected].
Either way, have a great weekend, flexible readers.
Brought to you by:

Unlock the power of DeFi with Odos!
Spanning 14 blockchain protocols, trusted by 3M+ unique wallets, and powering 80+ API partners, Odos delivers scale, reliability, and results you can count on.
Trade any token effortlessly with our cutting-edge order routing, seamless user experience, and fully transparent quotes. Ready to elevate your platform? Partner with Odos and bring advanced trading solutions straight to your users via API.
Start trading smarter with Odos today!


Network Rev, the SUI Mev Scene and AI’s Evolution

The Blockworks Research analysts discuss current market sentiment and share their thoughts on how the AI sector has evolved, and where it might be headed next.
Listen to 0xResearch on Spotify, Apple Podcasts or YouTube.

We finally got the unredacted OCP 2.0 letters from @FDICgov. It took a Court order but you can now read them for yourself below. They show a coordinated effort to stop a wide variety of crypto activity — everything from basic BTC transactions to more complex offerings. 1/3
— paulgrewal.eth (@iampaulgrewal)
5:02 PM • Jan 3, 2025
Jack Bogle keeps being proven right that US investors don't need international stocks.. a view that even his most ardent Boglehead supporters disagreed with. The US has run circles around int'l (albeit some periods where lags) since he first said this in his 1993 book Bogle on… x.com/i/web/status/1…
— Eric Balchunas (@EricBalchunas)
2:15 PM • Jan 3, 2025